Where is the S&P 500 going from here?
Posted on | Friday, December 18, 2009 | No Comments
In broad terms, that's a very simple question, the answer is up.
The reason has nothing to do with anything currency or economy related. It is because of something not often talked about. It's called survivorship bias.
Notice as of late the increase in S&P index rebalancing since November. Today was no exception with the addition of V and whoever else to the index. The index that you see day in and day out is comprised of only "winning" companies. The losers, or the failed bankrupt companies, are removed from the index and replaced with companies that have not yet failed.
To recreate what this looks like, take your cumulative net profit from every day the past month/year and plot it. Then subtract all the losing trades and once again plot your cumulative net profit. Compare the two. Congrats, you've just rebalanced the very same way we rebalance the S&P 500 by simply not recognizing the failures. Sure looks great doesn't it ;)
Keep in mind if you actually owned every company outright that was ever in the S&P, you too would be bankrupt. Funny how this business works.
Add some leverage to the mix and off we go!
cash close, futures close on fed day
Posted on | Wednesday, December 16, 2009 | No Comments
As heard in the pacific, west coast, midwest and east coast.
RE: fading volume
Barry Ritholtz ponders the following:
Here is another chart that worth pondering: Why has this rally continued on faltering volume? Why isn’t there greaterinstitutional participation in this?
The reason is, the largest spike in vol is inst paper buying and removing supply from the market. To the right of that, the 2nd largest volume spike on the chart is the continuation of the buying which also encapsulated the 666 spx lows. The removal of supply during these two periods (2 months of buying) created an imbalance of demand which resulted in rising prices.
How do we know this to be true?
Prices are rising, they cannot continue to fall in the absence of supply.
Why isn’t there greaterinstitutional participation in this?
They already did participate, in October and again in March.
However the same rules apply, the upward trend cannot continue in the absence of demand. This demand needs to be overpowered per se by a greater amount of supply. When that time comes, we will see 1 of two extremes, an enormous spike in volume, or a total absence of volume.We have yet to see either.
Note the two spikes in volume on the DJIA near the highs. The first pushed prices way down only to have them test the highs again but on dramatically less volume. That first push down removed demand from the market. We know this bc new high prints happened on low volume (no buyers) shortly thereafter. The 2nd vol spike again pushes prices lower in a similar way as before, again removing demand from the market by flooding it with supply. These are exactly the two situations we will see when the market is about to turn on the current rally.
Something to note is volume in December is usually always low because of Christmas. There is nothing abnormal with the current months volume and we still have two weeks left.
Remember Wallstrip? I do :)
Posted on | Wednesday, December 9, 2009 | No Comments
Still girl of the day
"What I wish I had been taught" when I first started trading
Posted on | Saturday, December 5, 2009 | 3 Comments
This is in response to Dr Brett's excellent series of posts for developing traders.
In my opinion this is holy grail information. The old adage is to buy low sell high. That sounds easy but so many seem to always buy the high only to have the rug get pulled out from under them, or sell the low only to to have the offers lifted.
Why is this?
People see declining prices and assume weakness and rising prices as strength. However it doesn't work this way.
Why not?
Markets move based on what is called "paper", ie institutional buyers and sellers. Dr. Brett just talked about this here. In FX its primarily central banks and institutional paper. These market participants make profits from price appreciation. The only way to do this is to buy at a discount and sell at a premium. Or, if short, sell at a premium and cover at a discount. Therefore they HAVE to buy when the market "looks" weak (trending down) and sell when it "looks" strong (trending up).
How do you know when institutions are in buying or selling so as to get on the "right" side of the price action?
You have to look at Volume. Volume is extremely important because he who controls the supply also control the demand. Institutions have more money than you do and will inherently control the demand (or lack there of) as a result. Specifically you are looking for abnormal increases in volume. I plot bollinger bands on top of my volume to clearly identity these nth standard deviation events.
You then have to look at the reaction of price to volume. Is it still trending in the original direction, has the trend slowed, has it reversed? Trends can only continue if there is enough volume to allow the imbalance of supply and demand to continue. If there isn't, there trend will reverse until price it met with volume once again to continue or reverse price.
You HAVE to look at larger time frames to find the bias of paper. They do not care (nor can they) about smaller time frames that smaller traders use. From there you can then time your entry and exit using the exact same methods of price and volume to enter and exit you trade.
Why does this work on larger and smaller time frames?
Price movement is a function of supply and demand which manifests itself on every time frame. The reason you need to look at larger time frames to get a bias is because if you don't, you will get whacked when a trader from a lager time frame (paper) comes in to make a trade. You are then at the mercy of whatever they are doing. He who controls the supply also controls the demand.
Long story short:
Market strength is NOT identified by "up" bars and conversely market weakness is NOT identified by "down bars". It's completely opposite because of how paper has to enter into trades. Strength manifests itself on down bars and weakness on up bars. See the picture below for examples of BOTH of these situations as well as trend continuation that is supported by volume. This is CL from Friday: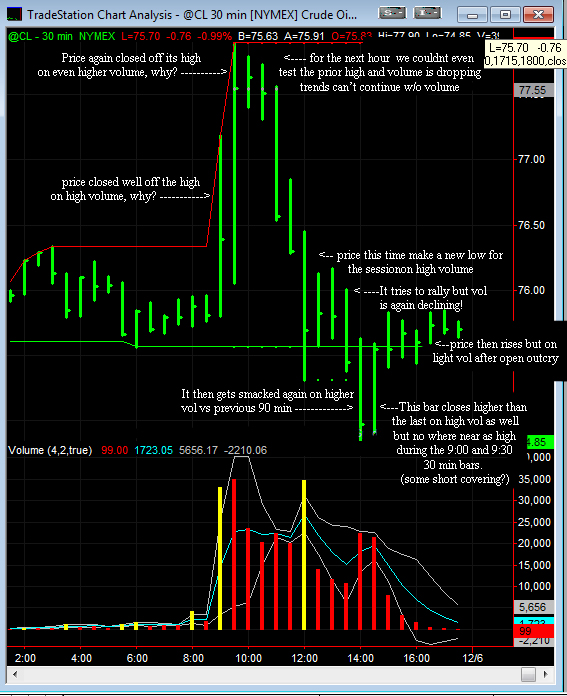
Why did price move higher to begin with?
Because of an influx of demand hit the market causing a breakout. Momentum traders, HFT then added to demand to increase prices.
Why did it fail so bad after making new highs?
Because institutional paper "absorbed" all of the demand from the move up (price never closed at the high of the bar). This is why volume dropped shortly after which led to prices NOT continuing higher (demand dried up). This resulted in an imbalance of supply vs demand which caused prices to fall.
Supply was then added to the market to create our first session low and then the second.
Why did price then bounce?
That supply was then "absorbed" by demand which resulted in an imbalance of demand which increased prices.
If trends cannot continue without without volume, how can we have rising prices on abnormally low volume?
You must be referring to these type of situations that everyone seems to hate. The reason is simple, on the prior instance of selling on high volume, that supply was absorbed by paper (otherwise there wouldn't have been high volume). This REMOVES supply from the market allowing for demand (no matter how weak) to lift prices. We know this happened because prices then began to rise!
What about if I'm really bearish on the economy and the market?
Paper doesn't care what you think, they will buy and sell without consideration to your viewpoint. As a trader your job is to make money, you do this buy identifying the same supply and demand imbalances that institutions are identifying. You will lose 100% of the time trading against paper. He who controls the supply also controls the demand.
Strength on down bars and weakness on up bars is intuitively backwards.
Yes. This is why 90% of traders lose money since they do not know how the market (any market) actually works or do not have the discipline to hold themselves accountable to playing by the rules.
Carry this further, 10% of the population is "wealthy". How? they had to do something completely different that the majority of the population in order to have above average compensation. They had to go against the majority of what they saw others doing. In essence, when the trend "looked" bad, the went long. When the trend "looked" good they went short.
Nigaz!
Posted on | Friday, December 4, 2009 | No Comments
Old but still funny as hell and the comments on the ZH post are even funnier
Gazprom building" border="0" height="170" hspace="0" vspace="0" width="226">
Gazprom could increase its power over European suppliesRussia's energy giant Gazprom has signed a $2.5bn (£1.53bn) deal with Nigeria's state operated NNPC, to invest in a new joint venture.
The new firm, to be called Nigaz, is set to build refineries, pipelines and gas power stations in Nigeria.
Analysts say the move could further strengthen Russia's role in supplying natural gas to Europe.
The agreement comes during a four-day African tour by Russian President Dmitry Medvedev.
As well as forming Nigaz, Russia is keen on developing a trans-African pipeline to transport Nigerian gas to Europe.
This could further reinforce Gazprom's already-strong influence over Europe's energy supplies.
'Commodity-rich'
"Russia has a number of goals [in Africa], one of which would be to take part in a growing competition for resources and markets on the continent - mainly with China," said Yaroslav Lissovolik, head economist with Deutsche Bank in Moscow.
Sergei Novikov, a spokesman for Rosatom, Russia's state-run civil nuclear energy agency, said the Nigaz deal would lay the foundations for building nuclear power reactors in Nigeria.
Nigeria has previously said it would like to develop a nuclear power plant to address its energy shortages.
Before visiting Nigeria, Mr Medvedev spent time in Egypt.
He is also visiting Namibia and Angola - which are rich in natural resources - during his trip, as he seeks to promote Russian business interests.
"Part of the agenda is to push Russia's credentials as a representative of commodity-rich developing countries with such forums as the G8 and the G20," said Ural Sib bank's chief strategist Chris Weafer in a note to investors.
Chinese deal
Russia is not alone in seeking to secure energy deals overseas with commodity-rich nations.
Separately on Thursday, Chinese oil refiner Sinopec has made a $7.2bn bid to acquire oil exploration and producing firm Addax, which focuses on Africa and the Middle East.
If the deal is approved by regulators it would be the biggest foreign takeover by a Chinese firm.
Misc mkt info
The move this am was a test for supply above our previous high of 1117. it was met with weak selling pressure relative to the push upward and eventually finished strong on high volume for the day. Bullish on ES
The euro finished just off its lows on the highest volume in 2 years. This is extremely bearish longer term. Global funds are obviously beginning to cover USD shorts, a good sign for the domestic eco. Bullish on USD
Bearish on gold.
Very bearish on the yen
Finally a good fn eco report!!!!!!
Short the crap out of gold. riskiest place to have $$ right now.
USD++ Yields++ GC to the dumpster
