New site BIDHITTER.COM
Posted on | Tuesday, April 20, 2010 | No Comments
If you're not automatically redirected click here
BIDHITTER
I keep this thing around for the archives!


Bove's got it right
Posted on | Monday, April 19, 2010 | No Comments
We've Moved! go to the new BIDHITTER site
BIDHITTER
Someone please explain this to me
Posted on | Sunday, April 18, 2010 | 1 Comment
http://www.zerohedge.com/article/correction-fib-618-extension-dot
A day before the GS news broke, we pointed out that the market is poised for a correction at least based on Fib. Sure enough, the ludicrous non-stop rally from the February lows topped at exactly a 61.8% extension of the previous sell-off (1211.6)). Was the Goldman news predicated by the SEC's religious following of Fibonacci signals? Is the 100% Fib retracement next (1144)?
So then we go to the post they're taking about and see this:
http://www.zerohedge.com/article/fun-fibonacci-and-great-depression
The Fib retracement from the highs to the lows in the cycle is now nearly 61.8 (at 1,228). The retracement from the highs to the lows in the first wave of the Great Depression peaked just below 61.8.Does history repeat itself, or come in tidy little Fibonacci packages? Are today's math Ph.D.'s even aware of retracements, or do they just know how to buy, buy, buy on ever declining volume? 1,228 is the magical number on the S&P. We'll find out soon enough.
I'm not too good with numbers but how does 1211.6 = 1228? Maybe someone could help out this product of public schools.
We've Moved! go to the new site! here
BIDHITTER
Video Recap for week ending 4/16/2010
Posted on | Saturday, April 17, 2010 | No Comments
april 16 from Walter Sobchak on Vimeo.
Related posts:
Barry Ritholtz goes after ZeroHedge
Charlie Gasparino on GS
Mory irony from ZeroHedge
ZeroHedge's justification for spewing falsehoods
Tyler Durden of ZeroHedge is a complete fucking dumbass, no seriously
We've Moved! go to the new site! here
BIDHITTER
Charlie Gasparino on GS
Posted on | Friday, April 16, 2010 | No Comments
We've Moved! go to the new site! here
BIDHITTER
GS Official statement
NEW YORK--(Business Wire)--
The Goldman Sachs Group, Inc. (NYSE: GS) said today:
We are disappointed that the SEC would bring this action related to a single
transaction in the face of an extensive record which establishes that the
accusations are unfounded in law and fact.
We want to emphasize the following four critical points which were missing from
the SEC`s complaint.
* Goldman Sachs Lost Money On The Transaction. Goldman Sachs, itself, lost more
than $90 million. Our fee was $15 million.We were subject to losses and we did
not structure a portfolio that was designed to lose money.
* Extensive Disclosure Was Provided. IKB, a large German Bank and sophisticated
CDO market participant and ACA Capital Management, the two investors, were
provided extensive information about the underlying mortgage securities. The
risk associated with the securities was known to these investors, who were among
the most sophisticated mortgage investors in the world. These investors also
understood that a synthetic CDO transaction necessarily included both a long and
short side.
* ACA, the Largest Investor, Selected The Portfolio. The portfolio of mortgage
backed securities in this investment was selected by an independent and
experienced portfolio selection agent after a series of discussions, including
with Paulson & Co., which were entirely typical of these types of transactions.
ACA had the largest exposure to the transaction, investing $951 million. It had
an obligation and every incentive to select appropriate securities.
* Goldman Sachs Never Represented to ACA That Paulson Was Going To Be A Long
Investor. The SEC`s complaint accuses the firm of fraud because it didn`t
disclose to one party of the transaction who was on the other side of that
transaction. As normal business practice, market makers do not disclose the
identities of a buyer to a seller and vice versa. Goldman Sachs never
represented to ACA that Paulson was going to be a long investor.
Background
In 2006, Paulson & Co. indicated its interest in positioning itself for a
decline in housing prices. The firm structured a synthetic CDO through which
Paulson benefitted from a decline in the value of the underlying securities.
Those on the other side of the transaction, IKB and ACA Capital Management, the
portfolio selection agent, would benefit from an increase in the value of the
securities. ACA had a long established track record as a CDO manager, having 26
separate transactions before the transaction. Goldman Sachs retained a
significant residual long risk position in the transaction
IKB, ACA and Paulson all provided their input regarding the composition of the
underlying securities. ACA ultimately and independently approved the selection
of 90 Residential Mortgage Backed Securities, which it stood behind as the
portfolio selection agent and the largest investor in the transaction.
The offering documents for the transaction included every underlying mortgage
security. The offering documents for each of these RMBS in turn disclosed the
various categories of information required by the SEC, including detailed
information concerning the mortgages held by the trust that issued the RMBS.
Any investor losses result from the overall negative performance of the entire
sector, not because of which particular securities ended in the reference
portfolio or how they were selected.
The transaction was not created as a way for Goldman Sachs to short the subprime
market. To the contrary, Goldman Sachs`s substantial longposition in the
transaction lost money for the firm.
The Goldman Sachs Group, Inc. is a leading global investment banking, securities
and investment management firm that provides a wide range of financial services
to a substantial and diversified client base that includes corporations,
financial institutions, governments and high-net-worth individuals. Founded in
1869, the firm is headquartered in New York and maintains offices in London,
Frankfurt, Tokyo, Hong Kong and other major financial centers around the world.
The Goldman Sachs Group, Inc.
Media:
Lucas van Praag, 212-902-5400
or
Investor:
Dane Holmes, 212-902-0300
Copyright Business Wire 2010
We've Moved! go to the new site! here
BIDHITTER
More Irony from ZH
Cramer "Breaks" News About Goldman Being Long Abacus, No Disclosure On Goldman's Short Exposure In The Structured Product
Creamer has just come to the rescue of this former co-workers at Goldman, claiming a "source" has notified him that Goldman was "long" Abacus. Well, duh - that's how structured finance works. They are long one tranche and short another. Cramer should also immediately provide "factual" information to all those who may have bought Goldman on his BS, whether Goldman wasin fact net short via CDS with AIG... Yeah, remember that whole thing about Goldman being short CDOs via CDS underwritten by AIG? Apparently it slipped the mind of Cramer's source. This is yet another semantic loophole abused by the world's greatest wealth destroying stock pumper. And by the way, Jim, take a look at the CDOs that Goldman had protection on AIG with before you "break" any more news, and find out what Goldman's exposure really was: because our sources tell us Goldman was short. Also, this is not even remotely a "game changer" at all, because the SEC's contention has nothing do with whether Goldman was shorting the CDO, but how the CDO was designed in the first place, with the explicit purpose of benefiting one party whose material involvement was not disclosed, and in fact was misrepresented!
Is Zerohedge in any position to demand someone provide factual information when they admit they cannot even provide factual info themselves? Please see ZeroHedges new justification for spewing falsehoods
We've Moved! go to the new site! here
BIDHITTER
Zero Hedge back to its bullshit ways
http://www.zerohedge.com/article/talk-pits-goldman-sold-1000-large-sps-earlier
Goldman sold 1,000 big SP today over 1,200.00. Was it just a hedge because they KNEW the SEC would do nail them to the cross? Is that insider trading? Who knows how many tens of thousands they sold in the ES?
Mkt is up how many fkn % off the low? Today ops ex? what a bunch of horse shit.
POP quiz kiddies! When mkts drop 1%, whose selling????? EVERYONE YAY!!!!!!!!
We've Moved! go to the new site! here
BIDHITTER
Here watch
Posted on | Monday, April 5, 2010 | No Comments
We've Moved! go to the new site! here
BIDHITTER
Video Recap week ending 4/2/2010
Posted on | Friday, April 2, 2010 | No Comments
We have a guest market recapper for this week! First a couple of observations:
S&P 500: The mini closed at 78 even today, breaking out of our two week range. Paper still very active scooping up contracts at discounted prices when they sell off. Bias is still long.
CL: GS upgraded entire energy sector on Monday, naturally that only works if CL catches a bid so paper also came through with a bid at about the same time. I posted on twitter that our short term bias had to change from bear to bull. Note: loooong term bias for CL has always been bullish for reasons outlined in previous vids. We have yet to beak the high from mid Oct 09, watch your price levels but no reason why we won't go higher. Cap and trade is still coming whether you like it or not.
EURUSD: Caught a bid like we thought. ZH is johnny on the spot with their posts trying to mock GS's markets calls. However, I think that the GS calls are deliberately incorrect... We're on the right side every time. There is no reason why they wouldn't be as well unless it's some type of PR campaign to demonstrate/generate sympathy, maybe. I prefer to think they did it to fuck with ZeroHedge. They clearly took the bait, as they would. They're not very smart. Paper came through again 3/31 and they were buyers, the same happened on 4/1. Today price declined, along with everything else that was open except for the S&P. I can't make a case to get or bullish or bearish until we see Monday. Today is simply too hard to interpret because of the lack of action.
Here is this weeks video recap from my girl GloZell! Be sure to check her out on youtube
Guest from Walter Sobchak on Vimeo.
Related posts:
Recap vid week ending 3/26

We've Moved! go to the new site! here
BIDHITTER
Tyler Durden @ ZeroHedge is a complete fucking dumbass... no seriously
Posted on | Sunday, March 28, 2010 | No Comments
Former Goldman Commodities Research Analyst Confirms LMBA OTC
Gold Market Is "Paper Gold" Ponzi
Tyler Durden's picture
Submitted by
Tyler Durden on 03/28/2010 12:47 -0500
When we put up a link to last week's CFTC hearing webcast little did we know that it would end up being the veritable (physical) gold mine (no pun intended) of information about what really transpires in the commodities market. First, we obtained direct evidence from Andrew Maguire (who may or may not have been the target of an attempt at "bodily harm" as reported yesterday) of extensive manipulation in the silver market. Today, Adrian Douglas, director of GATA, adds to the mountain of evidence that the commodities market, and the CFTC, stand behind what is potentially the biggest market manipulation scheme in the history of capital markets (we are assuming for the time being that all allegations of the Fed manipulating the broader equity and credit markets are completely baseless). Using the testimony of a clueless Jeffrey Christian, formerly a staffer at the Commodities Research Group in the Goldman Sachs Investment Research Department and now head and founder of the CPM Group, Douglas confirms that the "LBMA trades over 100 times the amount of gold it actually has to back the trades."
Christian, who describes himself as "one of the world’s foremost authorities on the markets for precious metals" yet, in the words of Gary Gensler, said "that the bullion banks had large shorts to hedge themselves selling elsewhere- how do you short something to cover a sale, I didn’t quite follow that?" and proves that current and former Goldman bankers are some of the most arrogant people alive, assuming that everyone else is an idiot and will buy whatever explanation is presented just because the CV says Goldman Sachs.
Children, when bullion banks are selling, its because someone(s) in physical is BUYING which drives the price up. Remember how when demand increases so does price from high school econ? Therefore banks (market makers) are inherently long which is why the sell short the futures. All the shit they have in inventory is APPRECIATING IN VALUE bc physical supply is dropping while they sell it to the buyers who are bid price up as supply drops. To cover the inevitable drop in price from the increase in physical inventory when retail sells ,(adds supply which results in lower prices, and banks HAVE to buy it back at lower prices), they short the futures!
The former GS guy is not arrogant, nor is he clueless as you claim, nor is he asuming everyone is an idiot as you also claim. You're just completely fucking retarded, Tyler. In fact, here's how clueless you are. You actually posted what I just said above in the video (for the illiterate) that you posted. Not only did this baffle your mind 1x while watching the video, you couldn't grasp the concept of supply and demand while seeing it in print for a second time.
J. CHRISTIAN: well, actually let’s go back to a concrete example of Mr. Organ when he was talking about August of 2008 when there was an explosion in the short positions in gold and silver held by the bullion banks on the futures market and he seemed to imply that that was somehow driving the price down. If you understand how those bullion banks run their books the reason they had an explosion in their short positions was because they were selling bullion hand over fist in the forward market, in the physical market, and in the OTC options market. Everyone was buying gold everywhere in the world so the bullion banks who stand as market makers were selling or making commitments to sell them material and so they had to hedge themselves and they were using the futures market to do that. So if you place position limits on the futures market they will have to find some other mechanism to hedge themselves …and they will. And someone else will provide that market…
Eco 101 strikes again.
Oh But wait he mispoke!???! OH SHIT!
CHAIRMAN GENSLER: I would like to follow up on Commissioner Dunn’s question for Mr. Christian, if I might, because I didn’t quite follow your answer on the bullion banks. You said that the bullion banks had large shorts to hedge themselves selling elsewhere, and I didn’t understand; I might just not have followed it and you’re closer to the metals markets than me on this, but how do you short something to cover a sale, I didn’t quite follow that?
J. CHRISTIAN: Well, actually I misspoke. Basically what you were seeing in August of 2008 was the liquidation of leveraged precious metals positions from a number of places and the bullion banks were coming back to buy it, and they were hedging those positions by going short on the COMEX and that is really what it was.
[Even on a second attempt Mr. Christian invents the most ridiculous poppycock to explain away the blatant manipulation of the precious metals in 2008. If, in his own words, investors were buying gold hand over fist everywhere in the world why would leveraged long holders dump all their long holdings? They would have ordinarily been making a fortune. The bank participation report of August 2008 shows that 2 or 3 bullion banks sold short the equivalent of 25% of world annual silver production in 4 weeks and the equivalent of 10% of world annual gold production. There was simultaneously a decrease in their long positions, which were almost non-existent anyway, which is incoherent with a notion the bullion banks were mopping up dumped leveraged investments. For an intelligent and coherent explanation of what happened in August 2008 read my CFTC written testimony here]
So now we have banks (any bank doesnt matter), going long physical and once again selling short futures to hedge in the face of a number of places selling? OH THE HORROR!!!
Here's the best part:
If, in his own words, investors were buying gold hand over fist everywhere in the world why would leveraged long holders dump all their long holdings?
Because you sell high and buy back low dumbass. Business 101.
We've Moved! go to the new site! here
BIDHITTER
Couple of vids to review
While building the latest systems I've had quite a bit of idle time and had a chance to review Free to Choose for the millionth time. Two episodes resonate well given our current times:
Important to note Fed policy has never followed statements by the Fed. Federal spending has always led to higher inflation,taxes and or both.
How people have grown dependent on government and the trap that entails.
We've Moved! go to the new site! here
BIDHITTER

Video recap week ending 3/26/2010
Posted on | Friday, March 26, 2010 | No Comments
This weeks topics:
S&P- bull, not enough info to get bear yet.
EURUSD- prob bull
Trade Tutorial!- You don't need any indicators besides price and volume
CL- bear
ZeroHedge- hypocrisy
three6Vid from Walter Sobchak on Vimeo.
Here's the clip from 25th hour I mentioned:
Related posts:
Zero Hedge tired of seeing computers trade like smart humans
Zero Hedge's new justification for spewing falsehoods
Interpreting volume and why Zero Hedge are morons
More nonsense from ZeroHedge

This subject is so important, I stole it
Posted on | Thursday, March 25, 2010 | 1 Comment
and
Many Traders Do Not Know About It.
"A trading system alone will not assure success without proper risk control, beginning with individual trades, extending to diversification of markets, and continuing until a portfolio of different trading strategies is created. Every trading style has losing streaks that will ruin an investor who begins trading at the wrong time without adequate capital; therefore the size of the position, the markets to trade, and when to increase or decrease leverage become important for financial survival." by Perry J. Kaufman
This image shows trading account drawdown percentages and what percentage gain is required to return your trading account back to the amount prior to the drawdown.
What percentage drawdown are you willing to have in your trading ?

Want smaller drawdowns ? - read on.
Learning risk control from a Coin Toss example
Simply because a coin only has two outcomes - heads or tails,
everybody knows the odds of a coin toss is 50 / 50.
With large numbers of Coin Tosses, results match the theoretical 50 / 50 outcome.
But most Traders commonly fall right into the Risk Trap of thinking each coin toss
will tend to alternate from heads to tails and then back to heads again.
Reality proves this only happens about 30% of the time.
So what happens the other 70% of the time ?
Exploring the Reality for an Actual 100 Coin Toss Exercise
Take out a coin,
On paper number from 1 -100
Make 100 actual coin tosses.
Recording each of the 100 coin tosses as Heads or Tails.
These next three images are a real recorded 100 coin toss event
Page1

Page 2

Page 3

The ACTUAL results showed a 14% spread instead of the expected 50 / 50 split.

This next image shows the long lossing streaks that occurred in this ACTUAL coin toss sample

The next image is critical to understand trading risk, it shows the trading account drawdown percentage that results from lossing streaks using different percentage of account equity at risk per trade and the single critical element you must control is what percentage of account equity you risk on each trade you take. That is a most important aspect to your trading success.

Traders the important part to understand from this posting is every strategy WILL have lossing streaks that most likely will be bigger than you might think. If you risk too big of a percent of equity on each trade you make your guaranteed given enough time trading to hit the Risk of Ruin event (in other words -> your account being busted).
I would not presume to suggest what another trader should risk. I do suggest to trade from an informed stand point of the relationships between position sizing, account equity at risk per trade and drawdowns. What I am saying it this posting is pick the maximum drawdown percentage your willing to suffer. Look at your strategies consecutive lossing steaks increase that by a safety margin and then use the chart to pick the percentage account equity at risk that will keep you under the drawdown level YOU have chosen.
Number One Worst Enemy Of Traders
Uncontrolled Risk from making large equity risking trades. Trading is not swinging for the fence home run while racking up a long string of strike outs. Controlling risk is the only way to stay in the trading game for the long haul.
Critical Key to Successful & Long Term Profitable Trading
Taking a profit from a very large number of extremely small percentage of equity risking trades. Keeping you account equity at risk per trade in the range from 1/2% to max of 3% . This equity at risk percentage per trade is not talking about the margin/buying power used to get in the trade it is the amount at equity at risk before your trade position hit your stoploss. If you do not have a very clearly defined stoploss on every trade, then look out your headed toward experience a Risk of Ruin experience.
Bottomline
1- Pick the maximum drawdown percentage your willing to suffer.
2- Look at your strategies consecutive loses then increase that number by a safety margin.
3- Next use the chart to pick the percentage account equity at risk that will keep you under the drawdown level YOU have chosen.
Low Risk Trading Strategy (from Van Tharp)
A Low Risk trading strategy is a strategy with a long-term positive expectancy that's traded at a equity percentage risk level to allow for the worst possible occurrence in the short term without the Risk of Ruin drawdown so that you are able to realize the long-term positive expectancy / profits from your strategy.
Video recap for week ending 3/19/2010
Posted on | Saturday, March 20, 2010 | No Comments
Sorry for the delay:
This weeks topics:
- Casino ads on the site to take your money
- Friday's sell off was healthy, paper bought small @ close
- S&P bias - down ****careful of Monday short squeeze****
- Euro Bias - flat, paper not in this last move down.
- Crude bias - down
- AUD bias - down
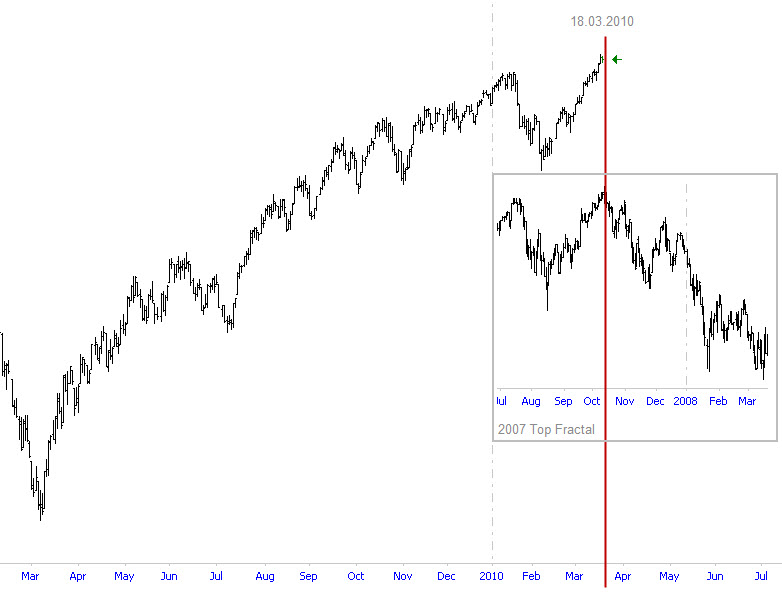
- 2007 vs 2010 market tops
- Slosh report
RecapWeek3/19 from Walter Sobchak on Vimeo.
The Slosh Report
Related posts:
Market recap vid for 3/12
Market sentiment ahead of the rally
A look at inflation vs deflation

A few observations
On the recap vid I said the near term direction of the S&P was a mixed bag of dicks. Now that my vol is showing up on the cash index, paper sold the cash 3/9, 3/10, 3/12 but not the futures. NYSE sentiment while negative today is really weak. Values of +/- 20K and greater indicates a healthy move up or down. We're currently at -2,600. There is still tons of time left today but this move down is not at all indicative of a giant trend reversal, just small time selling. Paper's still bullish.
Related posts:
Market recap vid for week 3/12/2010
Market sentiment before the rally
How to interpret volume

Signs of a market top
Posted on | Sunday, March 14, 2010 | No Comments
This is a just for fun post which probably has zero relevance. Feel free to add your ideas!
You know it's a market top when:
- FASB wants to reinstate M2M
- SEC bans short selling in dumb fk equity market
- Kudlow somehow turns even more bullish
- ZeroHedge gets unusually quiet on the "computers driving market higher" front
- Relative deflation ticks up yet equities rise
- The US actually starts recovering
- Some other CNBC anchor stats a hedge fund
- Dumb fk life insurance agents keeps referring to "when the market turns around" yet we're already up 70% from the lows
- Crammer tell yous to keeep you money in an insolvant bank again
- GOOG to 1000!
Words of wisdom from professor Friedman
"Politicians always try to avoid their last big mistake—which was clearly the 1930s. So every time there’s a contraction in the economy, they’ll overstimulate the economy, including printing too much money. The result will be a rising roller coaster of inflation, with each high and low being higher than the preceding one.”

