A look at market sentiment ahead of the rally
Posted on | Thursday, February 25, 2010 | 2 Comments
top looks at sentiment of the cash mkt, red line is S&P futures
middle is S&P pit sentiment, red line is S&P futures
bottom is dow futures sentiment, red line is dow futures.
*I dont plot the red lines, they're on here for comparison purposes of index movement vs sentiment only
green is bullish, magenta is bearish. If you're green you have a bullish bias, ie you long every pull back. If its magenta you short every rally.
note how the S&P pit was bullish the majority of the cash open, made a weak attempt at getting bearish then went bullish again after noon est.
cash was increasing in bullishness just after the pit went bull. dow futures lagged everyone but were still bullish ahead of the rally.
Then we had size come thru in the futures starting at 13:45 est, well after sentiment favored going long.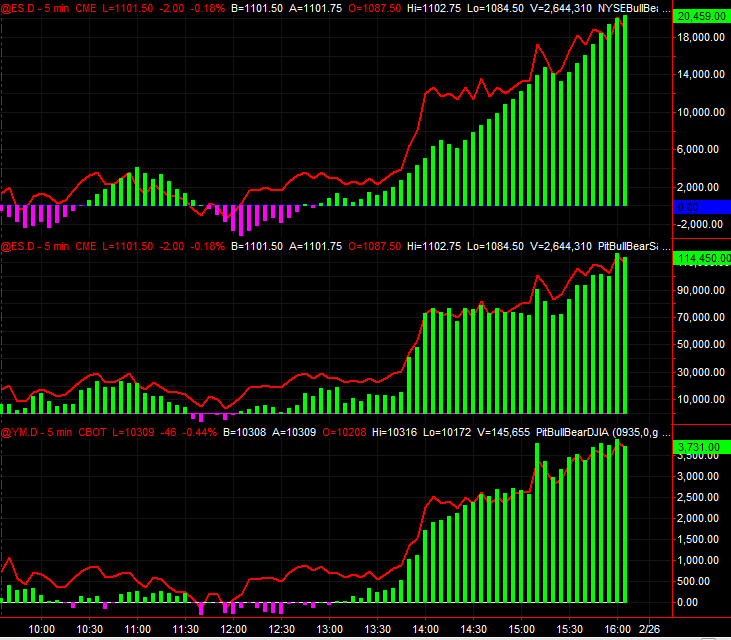
These sentiment indicators measure bulls vs bears in real time based on what is actually happening across the futures and the cash. They are not predictive, they are not designed to be predictive. They are mirror images of reality so that your bias is always on the right side of the market and what is actually happening. Technical analysis doesn't work. Thankfully, this isn't based off of anything technical.
Related posts:
A look at conflict between cash and futures pit
February 25, 2010 at 2:06 PM
where do you get this indicator? what brokerage or charting package?
February 25, 2010 at 5:08 PM
Hi
What trading platform are using to create the sentiment reader chart? Do you post yr trades during the day anywhere?
Thanks
Manoj Gattani
manojgattani@yahoo.com