New site BIDHITTER.COM
Posted on | Tuesday, April 20, 2010 | No Comments
If you're not automatically redirected click here
BIDHITTER
I keep this thing around for the archives!
Bove's got it right
Posted on | Monday, April 19, 2010 | No Comments
We've Moved! go to the new BIDHITTER site
BIDHITTER
Someone please explain this to me
Posted on | Sunday, April 18, 2010 | 1 Comment
http://www.zerohedge.com/article/correction-fib-618-extension-dot
A day before the GS news broke, we pointed out that the market is poised for a correction at least based on Fib. Sure enough, the ludicrous non-stop rally from the February lows topped at exactly a 61.8% extension of the previous sell-off (1211.6)). Was the Goldman news predicated by the SEC's religious following of Fibonacci signals? Is the 100% Fib retracement next (1144)?
So then we go to the post they're taking about and see this:
http://www.zerohedge.com/article/fun-fibonacci-and-great-depression
The Fib retracement from the highs to the lows in the cycle is now nearly 61.8 (at 1,228). The retracement from the highs to the lows in the first wave of the Great Depression peaked just below 61.8.Does history repeat itself, or come in tidy little Fibonacci packages? Are today's math Ph.D.'s even aware of retracements, or do they just know how to buy, buy, buy on ever declining volume? 1,228 is the magical number on the S&P. We'll find out soon enough.
I'm not too good with numbers but how does 1211.6 = 1228? Maybe someone could help out this product of public schools.
We've Moved! go to the new site! here
BIDHITTER
Video Recap for week ending 4/16/2010
Posted on | Saturday, April 17, 2010 | No Comments
april 16 from Walter Sobchak on Vimeo.
Related posts:
Barry Ritholtz goes after ZeroHedge
Charlie Gasparino on GS
Mory irony from ZeroHedge
ZeroHedge's justification for spewing falsehoods
Tyler Durden of ZeroHedge is a complete fucking dumbass, no seriously
We've Moved! go to the new site! here
BIDHITTER
Charlie Gasparino on GS
Posted on | Friday, April 16, 2010 | No Comments
We've Moved! go to the new site! here
BIDHITTER
GS Official statement
NEW YORK--(Business Wire)--
The Goldman Sachs Group, Inc. (NYSE: GS) said today:
We are disappointed that the SEC would bring this action related to a single
transaction in the face of an extensive record which establishes that the
accusations are unfounded in law and fact.
We want to emphasize the following four critical points which were missing from
the SEC`s complaint.
* Goldman Sachs Lost Money On The Transaction. Goldman Sachs, itself, lost more
than $90 million. Our fee was $15 million.We were subject to losses and we did
not structure a portfolio that was designed to lose money.
* Extensive Disclosure Was Provided. IKB, a large German Bank and sophisticated
CDO market participant and ACA Capital Management, the two investors, were
provided extensive information about the underlying mortgage securities. The
risk associated with the securities was known to these investors, who were among
the most sophisticated mortgage investors in the world. These investors also
understood that a synthetic CDO transaction necessarily included both a long and
short side.
* ACA, the Largest Investor, Selected The Portfolio. The portfolio of mortgage
backed securities in this investment was selected by an independent and
experienced portfolio selection agent after a series of discussions, including
with Paulson & Co., which were entirely typical of these types of transactions.
ACA had the largest exposure to the transaction, investing $951 million. It had
an obligation and every incentive to select appropriate securities.
* Goldman Sachs Never Represented to ACA That Paulson Was Going To Be A Long
Investor. The SEC`s complaint accuses the firm of fraud because it didn`t
disclose to one party of the transaction who was on the other side of that
transaction. As normal business practice, market makers do not disclose the
identities of a buyer to a seller and vice versa. Goldman Sachs never
represented to ACA that Paulson was going to be a long investor.
Background
In 2006, Paulson & Co. indicated its interest in positioning itself for a
decline in housing prices. The firm structured a synthetic CDO through which
Paulson benefitted from a decline in the value of the underlying securities.
Those on the other side of the transaction, IKB and ACA Capital Management, the
portfolio selection agent, would benefit from an increase in the value of the
securities. ACA had a long established track record as a CDO manager, having 26
separate transactions before the transaction. Goldman Sachs retained a
significant residual long risk position in the transaction
IKB, ACA and Paulson all provided their input regarding the composition of the
underlying securities. ACA ultimately and independently approved the selection
of 90 Residential Mortgage Backed Securities, which it stood behind as the
portfolio selection agent and the largest investor in the transaction.
The offering documents for the transaction included every underlying mortgage
security. The offering documents for each of these RMBS in turn disclosed the
various categories of information required by the SEC, including detailed
information concerning the mortgages held by the trust that issued the RMBS.
Any investor losses result from the overall negative performance of the entire
sector, not because of which particular securities ended in the reference
portfolio or how they were selected.
The transaction was not created as a way for Goldman Sachs to short the subprime
market. To the contrary, Goldman Sachs`s substantial longposition in the
transaction lost money for the firm.
The Goldman Sachs Group, Inc. is a leading global investment banking, securities
and investment management firm that provides a wide range of financial services
to a substantial and diversified client base that includes corporations,
financial institutions, governments and high-net-worth individuals. Founded in
1869, the firm is headquartered in New York and maintains offices in London,
Frankfurt, Tokyo, Hong Kong and other major financial centers around the world.
The Goldman Sachs Group, Inc.
Media:
Lucas van Praag, 212-902-5400
or
Investor:
Dane Holmes, 212-902-0300
Copyright Business Wire 2010
We've Moved! go to the new site! here
BIDHITTER
More Irony from ZH
Cramer "Breaks" News About Goldman Being Long Abacus, No Disclosure On Goldman's Short Exposure In The Structured Product
Creamer has just come to the rescue of this former co-workers at Goldman, claiming a "source" has notified him that Goldman was "long" Abacus. Well, duh - that's how structured finance works. They are long one tranche and short another. Cramer should also immediately provide "factual" information to all those who may have bought Goldman on his BS, whether Goldman wasin fact net short via CDS with AIG... Yeah, remember that whole thing about Goldman being short CDOs via CDS underwritten by AIG? Apparently it slipped the mind of Cramer's source. This is yet another semantic loophole abused by the world's greatest wealth destroying stock pumper. And by the way, Jim, take a look at the CDOs that Goldman had protection on AIG with before you "break" any more news, and find out what Goldman's exposure really was: because our sources tell us Goldman was short. Also, this is not even remotely a "game changer" at all, because the SEC's contention has nothing do with whether Goldman was shorting the CDO, but how the CDO was designed in the first place, with the explicit purpose of benefiting one party whose material involvement was not disclosed, and in fact was misrepresented!
Is Zerohedge in any position to demand someone provide factual information when they admit they cannot even provide factual info themselves? Please see ZeroHedges new justification for spewing falsehoods
We've Moved! go to the new site! here
BIDHITTER
Zero Hedge back to its bullshit ways
http://www.zerohedge.com/article/talk-pits-goldman-sold-1000-large-sps-earlier
Goldman sold 1,000 big SP today over 1,200.00. Was it just a hedge because they KNEW the SEC would do nail them to the cross? Is that insider trading? Who knows how many tens of thousands they sold in the ES?
Mkt is up how many fkn % off the low? Today ops ex? what a bunch of horse shit.
POP quiz kiddies! When mkts drop 1%, whose selling????? EVERYONE YAY!!!!!!!!
We've Moved! go to the new site! here
BIDHITTER
Here watch
Posted on | Monday, April 5, 2010 | No Comments
We've Moved! go to the new site! here
BIDHITTER
Video Recap week ending 4/2/2010
Posted on | Friday, April 2, 2010 | No Comments
We have a guest market recapper for this week! First a couple of observations:
S&P 500: The mini closed at 78 even today, breaking out of our two week range. Paper still very active scooping up contracts at discounted prices when they sell off. Bias is still long.
CL: GS upgraded entire energy sector on Monday, naturally that only works if CL catches a bid so paper also came through with a bid at about the same time. I posted on twitter that our short term bias had to change from bear to bull. Note: loooong term bias for CL has always been bullish for reasons outlined in previous vids. We have yet to beak the high from mid Oct 09, watch your price levels but no reason why we won't go higher. Cap and trade is still coming whether you like it or not.
EURUSD: Caught a bid like we thought. ZH is johnny on the spot with their posts trying to mock GS's markets calls. However, I think that the GS calls are deliberately incorrect... We're on the right side every time. There is no reason why they wouldn't be as well unless it's some type of PR campaign to demonstrate/generate sympathy, maybe. I prefer to think they did it to fuck with ZeroHedge. They clearly took the bait, as they would. They're not very smart. Paper came through again 3/31 and they were buyers, the same happened on 4/1. Today price declined, along with everything else that was open except for the S&P. I can't make a case to get or bullish or bearish until we see Monday. Today is simply too hard to interpret because of the lack of action.
Here is this weeks video recap from my girl GloZell! Be sure to check her out on youtube
Guest from Walter Sobchak on Vimeo.
Related posts:
Recap vid week ending 3/26
We've Moved! go to the new site! here
BIDHITTER
Tyler Durden @ ZeroHedge is a complete fucking dumbass... no seriously
Posted on | Sunday, March 28, 2010 | No Comments
Former Goldman Commodities Research Analyst Confirms LMBA OTC
Gold Market Is "Paper Gold" Ponzi
Tyler Durden's picture
Submitted by
Tyler Durden on 03/28/2010 12:47 -0500
When we put up a link to last week's CFTC hearing webcast little did we know that it would end up being the veritable (physical) gold mine (no pun intended) of information about what really transpires in the commodities market. First, we obtained direct evidence from Andrew Maguire (who may or may not have been the target of an attempt at "bodily harm" as reported yesterday) of extensive manipulation in the silver market. Today, Adrian Douglas, director of GATA, adds to the mountain of evidence that the commodities market, and the CFTC, stand behind what is potentially the biggest market manipulation scheme in the history of capital markets (we are assuming for the time being that all allegations of the Fed manipulating the broader equity and credit markets are completely baseless). Using the testimony of a clueless Jeffrey Christian, formerly a staffer at the Commodities Research Group in the Goldman Sachs Investment Research Department and now head and founder of the CPM Group, Douglas confirms that the "LBMA trades over 100 times the amount of gold it actually has to back the trades."
Christian, who describes himself as "one of the world’s foremost authorities on the markets for precious metals" yet, in the words of Gary Gensler, said "that the bullion banks had large shorts to hedge themselves selling elsewhere- how do you short something to cover a sale, I didn’t quite follow that?" and proves that current and former Goldman bankers are some of the most arrogant people alive, assuming that everyone else is an idiot and will buy whatever explanation is presented just because the CV says Goldman Sachs.
Children, when bullion banks are selling, its because someone(s) in physical is BUYING which drives the price up. Remember how when demand increases so does price from high school econ? Therefore banks (market makers) are inherently long which is why the sell short the futures. All the shit they have in inventory is APPRECIATING IN VALUE bc physical supply is dropping while they sell it to the buyers who are bid price up as supply drops. To cover the inevitable drop in price from the increase in physical inventory when retail sells ,(adds supply which results in lower prices, and banks HAVE to buy it back at lower prices), they short the futures!
The former GS guy is not arrogant, nor is he clueless as you claim, nor is he asuming everyone is an idiot as you also claim. You're just completely fucking retarded, Tyler. In fact, here's how clueless you are. You actually posted what I just said above in the video (for the illiterate) that you posted. Not only did this baffle your mind 1x while watching the video, you couldn't grasp the concept of supply and demand while seeing it in print for a second time.
J. CHRISTIAN: well, actually let’s go back to a concrete example of Mr. Organ when he was talking about August of 2008 when there was an explosion in the short positions in gold and silver held by the bullion banks on the futures market and he seemed to imply that that was somehow driving the price down. If you understand how those bullion banks run their books the reason they had an explosion in their short positions was because they were selling bullion hand over fist in the forward market, in the physical market, and in the OTC options market. Everyone was buying gold everywhere in the world so the bullion banks who stand as market makers were selling or making commitments to sell them material and so they had to hedge themselves and they were using the futures market to do that. So if you place position limits on the futures market they will have to find some other mechanism to hedge themselves …and they will. And someone else will provide that market…
Eco 101 strikes again.
Oh But wait he mispoke!???! OH SHIT!
CHAIRMAN GENSLER: I would like to follow up on Commissioner Dunn’s question for Mr. Christian, if I might, because I didn’t quite follow your answer on the bullion banks. You said that the bullion banks had large shorts to hedge themselves selling elsewhere, and I didn’t understand; I might just not have followed it and you’re closer to the metals markets than me on this, but how do you short something to cover a sale, I didn’t quite follow that?
J. CHRISTIAN: Well, actually I misspoke. Basically what you were seeing in August of 2008 was the liquidation of leveraged precious metals positions from a number of places and the bullion banks were coming back to buy it, and they were hedging those positions by going short on the COMEX and that is really what it was.
[Even on a second attempt Mr. Christian invents the most ridiculous poppycock to explain away the blatant manipulation of the precious metals in 2008. If, in his own words, investors were buying gold hand over fist everywhere in the world why would leveraged long holders dump all their long holdings? They would have ordinarily been making a fortune. The bank participation report of August 2008 shows that 2 or 3 bullion banks sold short the equivalent of 25% of world annual silver production in 4 weeks and the equivalent of 10% of world annual gold production. There was simultaneously a decrease in their long positions, which were almost non-existent anyway, which is incoherent with a notion the bullion banks were mopping up dumped leveraged investments. For an intelligent and coherent explanation of what happened in August 2008 read my CFTC written testimony here]
So now we have banks (any bank doesnt matter), going long physical and once again selling short futures to hedge in the face of a number of places selling? OH THE HORROR!!!
Here's the best part:
If, in his own words, investors were buying gold hand over fist everywhere in the world why would leveraged long holders dump all their long holdings?
Because you sell high and buy back low dumbass. Business 101.
We've Moved! go to the new site! here
BIDHITTER
Couple of vids to review
While building the latest systems I've had quite a bit of idle time and had a chance to review Free to Choose for the millionth time. Two episodes resonate well given our current times:
Important to note Fed policy has never followed statements by the Fed. Federal spending has always led to higher inflation,taxes and or both.
How people have grown dependent on government and the trap that entails.
We've Moved! go to the new site! here
BIDHITTER
Video recap week ending 3/26/2010
Posted on | Friday, March 26, 2010 | No Comments
This weeks topics:
S&P- bull, not enough info to get bear yet.
EURUSD- prob bull
Trade Tutorial!- You don't need any indicators besides price and volume
CL- bear
ZeroHedge- hypocrisy
three6Vid from Walter Sobchak on Vimeo.
Here's the clip from 25th hour I mentioned:
Related posts:
Zero Hedge tired of seeing computers trade like smart humans
Zero Hedge's new justification for spewing falsehoods
Interpreting volume and why Zero Hedge are morons
More nonsense from ZeroHedge
This subject is so important, I stole it
Posted on | Thursday, March 25, 2010 | 1 Comment
and
Many Traders Do Not Know About It.
"A trading system alone will not assure success without proper risk control, beginning with individual trades, extending to diversification of markets, and continuing until a portfolio of different trading strategies is created. Every trading style has losing streaks that will ruin an investor who begins trading at the wrong time without adequate capital; therefore the size of the position, the markets to trade, and when to increase or decrease leverage become important for financial survival." by Perry J. Kaufman
This image shows trading account drawdown percentages and what percentage gain is required to return your trading account back to the amount prior to the drawdown.
What percentage drawdown are you willing to have in your trading ?

Want smaller drawdowns ? - read on.
Learning risk control from a Coin Toss example
Simply because a coin only has two outcomes - heads or tails,
everybody knows the odds of a coin toss is 50 / 50.
With large numbers of Coin Tosses, results match the theoretical 50 / 50 outcome.
But most Traders commonly fall right into the Risk Trap of thinking each coin toss
will tend to alternate from heads to tails and then back to heads again.
Reality proves this only happens about 30% of the time.
So what happens the other 70% of the time ?
Exploring the Reality for an Actual 100 Coin Toss Exercise
Take out a coin,
On paper number from 1 -100
Make 100 actual coin tosses.
Recording each of the 100 coin tosses as Heads or Tails.
These next three images are a real recorded 100 coin toss event
Page1

Page 2

Page 3

The ACTUAL results showed a 14% spread instead of the expected 50 / 50 split.

This next image shows the long lossing streaks that occurred in this ACTUAL coin toss sample

The next image is critical to understand trading risk, it shows the trading account drawdown percentage that results from lossing streaks using different percentage of account equity at risk per trade and the single critical element you must control is what percentage of account equity you risk on each trade you take. That is a most important aspect to your trading success.

Traders the important part to understand from this posting is every strategy WILL have lossing streaks that most likely will be bigger than you might think. If you risk too big of a percent of equity on each trade you make your guaranteed given enough time trading to hit the Risk of Ruin event (in other words -> your account being busted).
I would not presume to suggest what another trader should risk. I do suggest to trade from an informed stand point of the relationships between position sizing, account equity at risk per trade and drawdowns. What I am saying it this posting is pick the maximum drawdown percentage your willing to suffer. Look at your strategies consecutive lossing steaks increase that by a safety margin and then use the chart to pick the percentage account equity at risk that will keep you under the drawdown level YOU have chosen.
Number One Worst Enemy Of Traders
Uncontrolled Risk from making large equity risking trades. Trading is not swinging for the fence home run while racking up a long string of strike outs. Controlling risk is the only way to stay in the trading game for the long haul.
Critical Key to Successful & Long Term Profitable Trading
Taking a profit from a very large number of extremely small percentage of equity risking trades. Keeping you account equity at risk per trade in the range from 1/2% to max of 3% . This equity at risk percentage per trade is not talking about the margin/buying power used to get in the trade it is the amount at equity at risk before your trade position hit your stoploss. If you do not have a very clearly defined stoploss on every trade, then look out your headed toward experience a Risk of Ruin experience.
Bottomline
1- Pick the maximum drawdown percentage your willing to suffer.
2- Look at your strategies consecutive loses then increase that number by a safety margin.
3- Next use the chart to pick the percentage account equity at risk that will keep you under the drawdown level YOU have chosen.
Low Risk Trading Strategy (from Van Tharp)
A Low Risk trading strategy is a strategy with a long-term positive expectancy that's traded at a equity percentage risk level to allow for the worst possible occurrence in the short term without the Risk of Ruin drawdown so that you are able to realize the long-term positive expectancy / profits from your strategy.
Video recap for week ending 3/19/2010
Posted on | Saturday, March 20, 2010 | No Comments
Sorry for the delay:
This weeks topics:
- Casino ads on the site to take your money
- Friday's sell off was healthy, paper bought small @ close
- S&P bias - down ****careful of Monday short squeeze****
- Euro Bias - flat, paper not in this last move down.
- Crude bias - down
- AUD bias - down
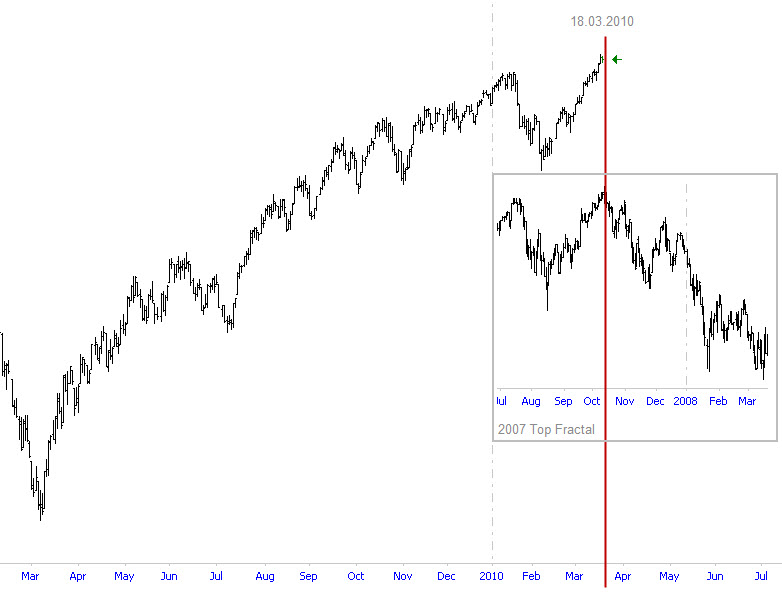
- 2007 vs 2010 market tops
- Slosh report
RecapWeek3/19 from Walter Sobchak on Vimeo.
The Slosh Report
Related posts:
Market recap vid for 3/12
Market sentiment ahead of the rally
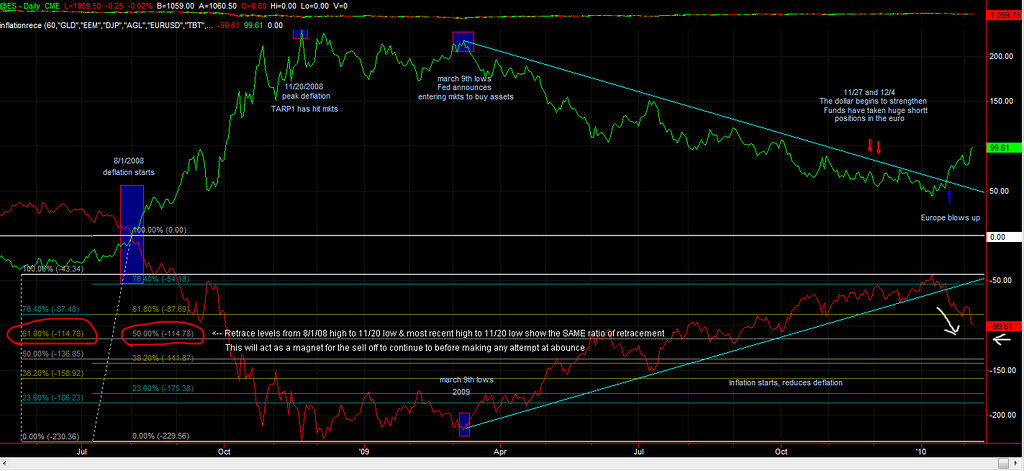
A look at inflation vs deflation
A few observations
On the recap vid I said the near term direction of the S&P was a mixed bag of dicks. Now that my vol is showing up on the cash index, paper sold the cash 3/9, 3/10, 3/12 but not the futures. NYSE sentiment while negative today is really weak. Values of +/- 20K and greater indicates a healthy move up or down. We're currently at -2,600. There is still tons of time left today but this move down is not at all indicative of a giant trend reversal, just small time selling. Paper's still bullish.
Related posts:
Market recap vid for week 3/12/2010
Market sentiment before the rally
How to interpret volume
Signs of a market top
Posted on | Sunday, March 14, 2010 | No Comments
This is a just for fun post which probably has zero relevance. Feel free to add your ideas!
You know it's a market top when:
- FASB wants to reinstate M2M
- SEC bans short selling in dumb fk equity market
- Kudlow somehow turns even more bullish
- ZeroHedge gets unusually quiet on the "computers driving market higher" front
- Relative deflation ticks up yet equities rise
- The US actually starts recovering
- Some other CNBC anchor stats a hedge fund
- Dumb fk life insurance agents keeps referring to "when the market turns around" yet we're already up 70% from the lows
- Crammer tell yous to keeep you money in an insolvant bank again
- GOOG to 1000!
Words of wisdom from professor Friedman
"Politicians always try to avoid their last big mistake—which was clearly the 1930s. So every time there’s a contraction in the economy, they’ll overstimulate the economy, including printing too much money. The result will be a rising roller coaster of inflation, with each high and low being higher than the preceding one.”

Weekly recap vid for 3/12/2010
Posted on | Friday, March 12, 2010 | No Comments
Topics:
Volume: Don't be a dumbass look at the bigger picture
S&P: Mixed signals across cash and futures, bullish until demand drops off
Euro: Bullish, ZeroHedge finally agrees 3 weeks late.
Crude: Bearish, not time for 84 yet
Twitter: Gave you the jump on institutional buying this pm, while ZeroHedge blamed computers 20 min after we told you. Still no clue how they make money, they're as accurate as cnbc.
week 3/12 from Walter Sobchak on Vimeo.
Related posts:
Market Recap vid for week ending 3/5/2010
An adult look at volume
An adult look at volume
Posted on | Tuesday, March 9, 2010 | No Comments
I say adult because we'll use some logic and common fn sense vs little kiddies who are still afraid of the dark.
Below is a pic of the weekly S&P volume. The area between the magenta lines is roughly when greenspan cut interest rates and we had a credit bubble. When you have credit bubbles you also have asset bubbles, like the stock market. The horizontal is last weeks volume. Note that it is roughly the same as it was during the peak of the credit bubble.
For the sake of humanity, please hit those with bats who say we are running out of volume and no one is trading the markets anymore aside from robots and computers. They are clearly full of bs.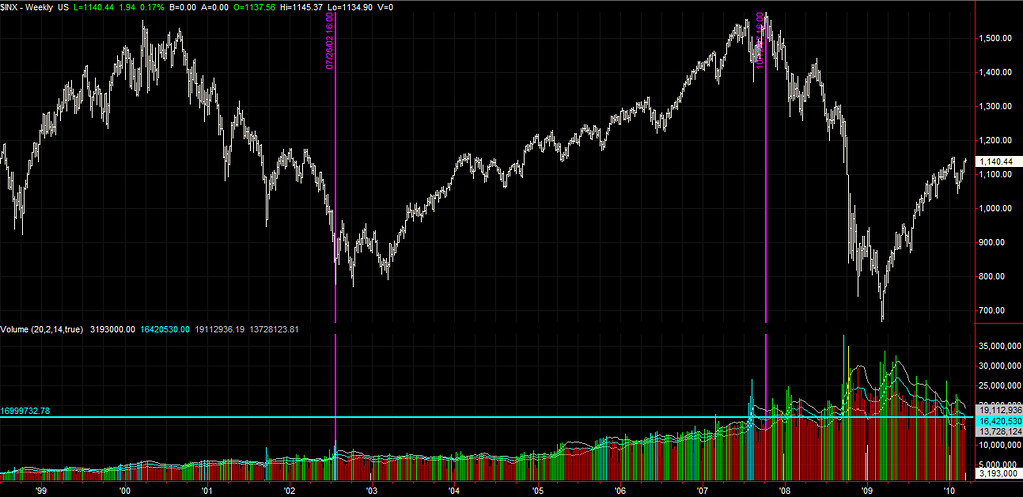
Market recap vid for week ending 3/5/2010
Posted on | Friday, March 5, 2010 | 2 Comments
week35 from Walter Sobchak on Vimeo.
Related posts:
Market recap for week ending 2/26/2010
Market sentiment the past 3 days
Posted on | Thursday, March 4, 2010 | No Comments
With ZH putting the lid on frivolous market manipulation posts, lets have a look at sentiment the past few days: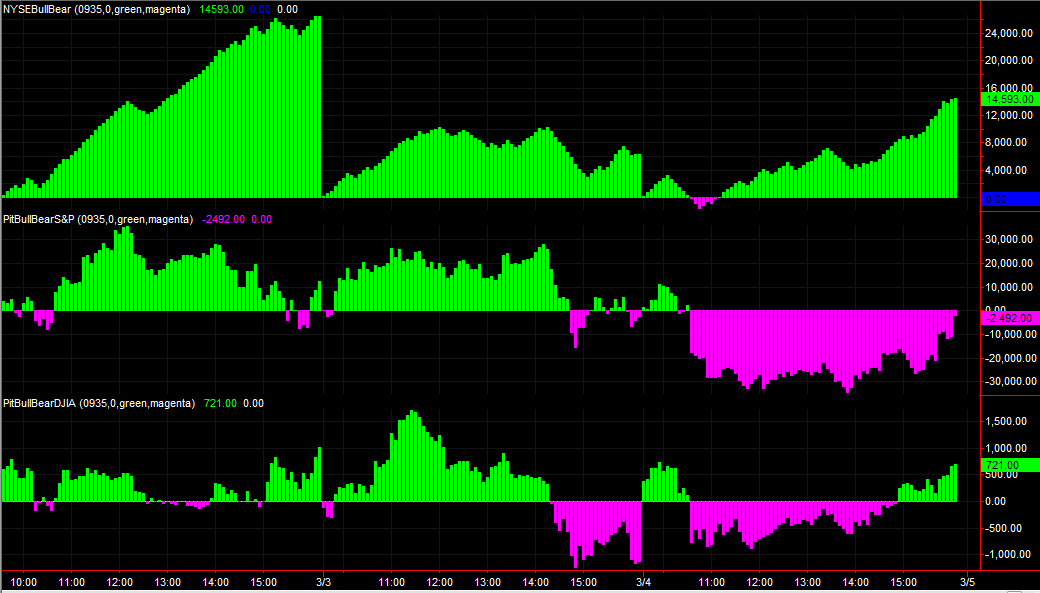
Green is bull, magenta bear. Greater than 20K in the cash market at the cash close is a healthy strong day. When the pit and djia futures conflict with the cash mkt, we get mixed range bound days. Cash market defines your bias, S&P pit and djia futures help you determine if everyone else is on board.
Related posts:
A look at market sentiment ahead of the rally
A look at conflict in the cash and futures pit
Market recap vid for 2/26/2010
Posted on | Friday, February 26, 2010 | No Comments
week2/26 from Walter Sobchak on Vimeo.
Related Posts:
Zero Hedge tire of seeing computers trade like humans
Zero Hedge's new justification for spewing falsehoods
Market recap vid for week ending 2/12/2010
A look at market sentiment ahead of the rally
Posted on | Thursday, February 25, 2010 | 2 Comments
top looks at sentiment of the cash mkt, red line is S&P futures
middle is S&P pit sentiment, red line is S&P futures
bottom is dow futures sentiment, red line is dow futures.
*I dont plot the red lines, they're on here for comparison purposes of index movement vs sentiment only
green is bullish, magenta is bearish. If you're green you have a bullish bias, ie you long every pull back. If its magenta you short every rally.
note how the S&P pit was bullish the majority of the cash open, made a weak attempt at getting bearish then went bullish again after noon est.
cash was increasing in bullishness just after the pit went bull. dow futures lagged everyone but were still bullish ahead of the rally.
Then we had size come thru in the futures starting at 13:45 est, well after sentiment favored going long.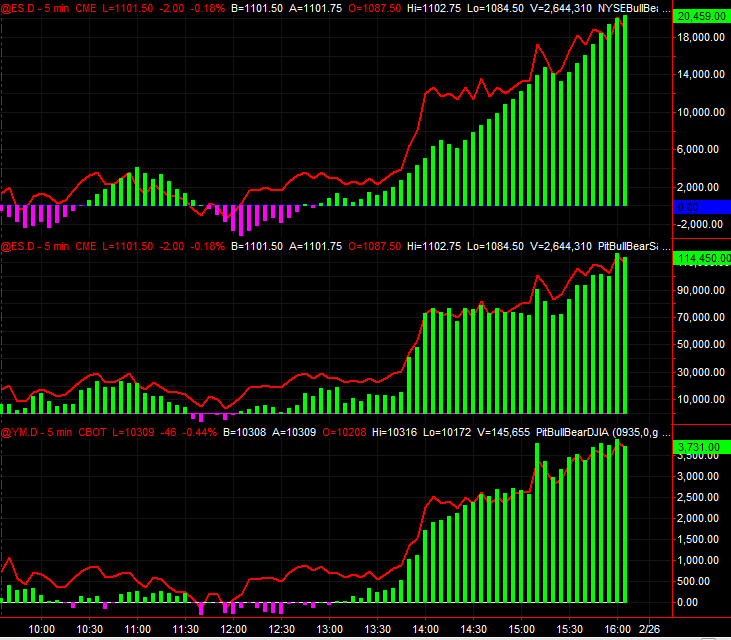
These sentiment indicators measure bulls vs bears in real time based on what is actually happening across the futures and the cash. They are not predictive, they are not designed to be predictive. They are mirror images of reality so that your bias is always on the right side of the market and what is actually happening. Technical analysis doesn't work. Thankfully, this isn't based off of anything technical.
Related posts:
A look at conflict between cash and futures pit
Zero Hedge "tired" of seeing computers trade like smart humans
Posted on | Wednesday, February 24, 2010 | No Comments
Long story short: ZH is mad again that an Evil Machine buys low when selling pressure subsides and sells into strength for a profit like a profitable human does! Oh the HORROR!
I don't even trade the market they're talking about but lets be rational for 2 fn seconds:
Now for the juicy stuff...For months now i have been watching a specific
algorithm push our markets around with great ease. It looks like this algo is
giving the SPY a little push through support and resistance levels with massive
size executed in seconds. Sometimes the push is tens of thousands of shares, the
size all depends on the natural volume around the level which the SPY is trading
at the time it may need a "Jump". For instance if the market is oversold on a 1
min time frame and is trying to break higher off lows but just cant get the
party going on its own, the algo will come in and take offers until day traders,
scalpers, swing traders jump in and chase the market higher. Once the price gets
"jumped" the algo just sits and waits till natural buyers and sellers are few
and far between and it either dumps or takes in more. Usually the program will
reset itself after a trade, then will wait till it senses low volume once again.
For some concrete evidence of this action i have done a quick
illustration, which includes Time & Sales which only display prints on the
exchange the algorithm does business on. This exchange is used because of its
very nice rebate structure, and it allows the algo to exploit the SOES, meaning
it cannot trade in blocks larger than 10000 shares per order. So what does it
do, it takes blocks almost 10,000 shares multiple times a second, this price
action causes the market to lift violently. This is not small money, remember
small money follows big money.
The algo in question starts buying at
110.04 with one block of 9999 shares, followed by 60k more shares all bought in
under two minutes. You can see from the chart how the SPY reacted, it violently
moved higher all the way up to 110.55, where the algo dumped just about all of
the shares, you can see the prints in the "dump" prints window, again only
showing the print from the exchange the algo does business on. The algo did its
job, the cash market snapped back, the components again caught a bid and moved
higher through resistance. I.E. they look alive and well... Natural buyers came
in above the 110.55 level chasing the market up another 50 cents or so before
they left and the SPY fell again because the volume was not there to support the
massive run up which took place over 15 minutes. As you can see the algo works
in two capacities, it manipulates the market to the upside along with keeping
S&P500 components trading in a liquid orderly "non flat" fashion.
Theses geniuses even show a chart of how smart the Evil Machine is (click this Gem to make it larger):

1: Green circle around the volume? that's your key into selling pressure subsiding on that move down. That means sellers are done adding supply to the market and declining prices are DONE declining. See how they say "Natural buyers very thin", it's SELLERS that are thin. You know this because the DECLINE IN PRICE HAS STOPPED. It only stops if sellers stop adding supply greater than existing demand OR incoming demand forces price to stop declining because it exceeds the sellers supply.
1A: There is no fucking such thing as a "natural buyer". Algo or Human, all the supply/demand coming in to a mkt still counts kid-o, regardless of who/what initiated it.
2: No shit you buy here, in fact look at everyone else who did in their time and sales. See all the green at offer BEFORE the Evil Machine came in? People buying bc shits cheap and selling has subsided.
3: Remember how you profit when buy low? That's right, you HIT THE BID and sell it back to all the suckers now buying at already marked up prices. And they did, look at the red in the next time and sales besides what they have circled. People and the Evil machine hitting the bid to book profits OH THE HORROR.
View the complete post on how disturbed they are that they don't understand these concepts here
Buy low sell high is far from a new concept. Here is some recommended reading so you don't blame your trading ineptitude on computers. I will not waste your time w BS links and fkd up conjectured theories that have zero relevance to making money to justify my losses.
Disclaimer: I have no affiliation with Dr. B but he's dead on in what he writes about. He'd probably hate my guts if he ever saw this site.
Related Topics:
What I wish I had been taught when I first started trading @ BIDHITTER
Fade What You See
A Framework For Thinking About Short Term Market Behavior
Anatomy of a Market Breakout
Using Market Delta In Trading
Five Guiding Principles for Short Term Trading
Zero Hedge's New Justification for Spewing Falsehoods
Look at this crap
Check out this dude using ninjatrader's market replay posing as if he was making real trades to sell his shit.
He recorded the session, then REPLAYED it on the simulator and took trades to make it look like it was real, however he already knew the direction of the market.
I'd like to see his argument against this. Too bad for him he has time and sales up and it doesn't even move. In real life time and sales flies on the minis. Uh oh NT doesn't record time and sales. SCAMOLAAAAAAAA
http://www.tradersinternational.com/library/tod/2010/02/18/18.html
here's his disclaimer he pops up, for -0.31243 seconds, indicating its a scam.
HE SHOULD BE LIKE US AND TELL YOU EVERYTHING IS A GIANT RACKET AHEAD OF TIME!!!!!!! VISIT ALL OUR AFFILIATES AND MAKE US TONS OF MONEY!
im off to get some drinks.
A look at conflict in the cash and futures pit
Here's a look at sentiment on friday and again today. Note the extreme bearishness in the futures vs the cash today. Compare that to the bullishness from friday in both markets (Green in both, also NYSE sentiment was 20K vs todays's 6K). Friday the pit sentiment dropped off as traders took profits into rising prices, selling high.
Although sentiment increased in the pit this PM, it dropped sharply into the close just after the NYSE sentiment began to decline.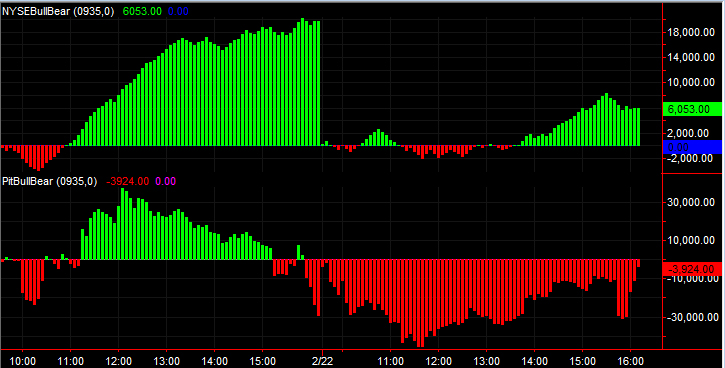
Market recap for week ending 2/19/2010
Posted on | Friday, February 19, 2010 | No Comments
week2/19/2010 from Walter Sobchak on Vimeo.
Related Posts:
Market recap for weekending 2/12/2010
The real reason the market won't crash
Interpreting volume and why Zerohedge are morons
LMAO they DID blame robots for todays market move
Posted on | Tuesday, February 16, 2010 | 1 Comment
Zerohedge is at it again with its "market up because of robots" again! The stupidity never ceases to amaze me! Why they can't understand that markets can move with less than average volume is way beyond me.
Luckily BIDHITTER followers are smart and realize that the laws of supply and demand still exist regardless of how many people show up to play. Furthermore broad market (IE GLOBAL) sediment was BULLISH well before the cash mkt opened. Why justify today's move on robots when you clearly have ZERO clue what you are talking about?
Looks like Johnny 5 blew up another account!
A SPY block moves market by several points. We exaggerate. (Not really).
Volume down, market up, volume up, market down. Rinse, repeat. Computers are
happy as pigs in a trough as shorts refuse to even dip a toe in this busted
market. China tightening? Greece collapse? Record debt overhang? Pulled IPOs and
HY deals? Who cares. The algos are sniffing and providing liquidity.
Related posts:
ZeroHedge justifies spewing falsehoods
Interpreting Volume and why Zero Hedge are morons
Zero Hedge is starting up with their BS again
Computers... Right.
Zero Hedge's new justifcation for spewing falsehoods
Posted on | Saturday, February 13, 2010 | No Comments
Abstract:
The majority of our "news" is total crap because we are understaffed.
(I'm not making this up see for yourself Here)
But, having waxed poetic on our greatness and accomplishments, it falls to us to admit that there is a Dark Side(tm) to employing a non-professional (read: unpaid) and skeleton crew. We miss quite a lot. (Right, like truthful statements) Our tips@zh inbox sees about 200-300 emails per day, of which perhaps 15% are penis enlargement advertisements and 25% represent actionable, interesting material. Yesterday between 12:00am and 11:59pm we processed more than 1700 comments. No, that's not a typo. We are hosting over 225,000 comments in total today.
As you will quickly see, it is literally impossible for
a newsroom as sparse as ours to cover such a beat. We miss quite a lot of
interesting stories. Many reader tips are, if not ignored, simply lost in the
static. More significantly, Zero Hedge employs no "Managing
Editor." (We know, it shows)
Unfortunately, Zero Hedge, which was but a small online carve-out lost in a salty sea of Blogger.com foam only 10 months ago, has reached a point where the weight of subject matter we regularly manage requires a bit more care and attention than we have been able to give before now. (No kidding.)
It is for this reason that Zero Hedge has retained our first Ombuds(wo)man.
It would not be waterboarding the matter in the least to suggest that Zero Hedge is a literal lightening rod for criticism. Nor would it be out of place to point out that, where it is dismissed, Zero Hedge tends to fall into the
"extraordinary claims require extraordinary evidence" bucket. True, we have hit a number of very thin nails on the head (national security exceptions to financial disclosures and AIG balance sheets come to mind). But, to the extent "extraordinary evidence" is the side of that balance sheet that readers (or non-reader critics) find lacking, we are underperforming in the marketplace. This will not do. (The first step to recovery is admitting you have a problem. This is good)
The sorts of small details that are likely to escape a writing staff with no formal editors in-house, quite obviously, escape us- as we have no formal editors in-house. Moreover, despite the fact that we maintain a dedicated abuse / legal team (with a dedicated inbox that we monitor pretty closely), most Zero Hedge criticism seems to find root in
the pages of other blogs, whose authors do not appear to regard comment from us as a pre-requisite to unfettered publication. Often, we learn of some "cutting" rebuke somewhere in the blogosphere (or even the mainstream media) days or even weeks after its publication. In fact, it seems to be the rule that issues of citation, clerical or even significant factual errors on Zero Hedge play out in public before we ever hear of them. This month (as you may have noticed) has been no exception.
(Oh the irony. They can follow BIDHITTER with an RSS reader and can also follow us off a cliff on twitter. They can also type in http://bidhitter.blogspot.com/ into a fancy web browser and in less than a min they will wind up here. Cooler yet, they can load us up on their MP3 player! It's the wave of the future.)
Related posts:
Interpreting Volume and why Zero Hedge are morons
Zero Hedge is starting up with their BS again
Computers... Right.
Market recap for week ending 2/12/2010
Posted on | Friday, February 12, 2010 | No Comments
week212 from Walter Sobchak on Vimeo.
Related posts:
Interpreting volume and why Zero Hedge are morons
Zero Hedge starting up with their BS again
Equity market sell off
The global macro theme doesn't have much to do with the domestic equity market sell off. We've been pricing in future growth for a year. Apparently it's here and we've recovered fundamentally. If that's true, we should sell off as our future pricing in of growth has been fully realized. Markets are forward looking discounting mechanisms, not real time. Those appearing on TV who "don't understand the reason for the sell off given the strong fundamentals" are simply foreshadowing their eventual demise.
Andrew Ross Sorkin
Is on cnbc morning joe or whataver it's called. Watch ZH bust a nut over it's man crush... we need something about bonds catching a bid even though the auction went for shit yesterday too
Banned from twitter?
Posted on | Thursday, February 11, 2010 | No Comments
We lasted all of 12 hours onf twitter before they suspended us for reasons still unknown.
Maybe it was all the porn stars we friended.
I wonder...
I wonder if ZH will figure out that the NYSE actually was trading on the computer today :)

Push them lower Tyler you can do it!!!
Posted on | Tuesday, February 9, 2010 | No Comments
BOOM: 12:53 02/09 PRESS: GERMANY GOVT SPOX: GREECE MUST SOLVE OWN BUDGET PROBLEM
2 minutes ago from TweetDeck
German gov't official: rumors are UNFOUNDED
3 minutes ago from TweetDeck
what a day 12:50 02/09 PRESS: GERMANY GOVT DENIES GREECE AID PACKAGE NEARLY DONE DEAL
half a minute ago from TweetDeck
New post: Here Comes The Selling As Germany Claims Greek Bailout Rumors Are Unfounded, Confusion Reigns http://tinyurl.com/yevjzy5
2 minutes ago from Drupal

The silence is deafening at Zero Hedge
no new tweets!? IM SHOCKED!!!!!! Where is my trusted news source when I need them!?
edit: they're back from the dead
# Citi Breaks Secondary Price, As News Of Big Fat Greek Bailout "In Broad Sense Of The Word" Skyrockets Market http://bit.ly/blzmxd 2 minutes ago from TweetDeck
Go look again im sure it was just JPM buying SPY shares
The futures market must be rallying

And Zero Hedge is trying to tweet it lower:
http://twitter.com/zerohedge
# 09:11 02/09 EU ALMUNIA: SERIOUS RISK OF GREEK SPILLOVER ELSEWHERE IN EMU 11 minutes ago from TweetDeck
# Greek spread widening picks up. 318 an hour ago, now 332 24 minutes ago from TweetDeck
# Chris Whalen Guest Post: OTC Derivatives: Is the DTCC Too Big To Fail? http://bit.ly/dqSPwd 26 minutes ago from TweetDeck
# After ripping tighter earlier, GGBs are now being sold aggressively 32 minutes ago from TweetDeck
# 08:27 02/09 ECB NOWOTNY: ON BASIS NUMBERS UK MOST IN DANGER OF CONTAGION about 1 hour ago from TweetDeck
# Bailout: 08:25 02/09 ECB NOWOTNY: ECB HAS A CLEAR NO-BAILOUT CLAUSE about 1 hour ago from TweetDeck
# New post: Uh, What Greek Bailout? http://tinyurl.com/yfo2ylp about 1 hour ago from Drupal

Play Online Poker
Interpreting volume and why Zero Hedge are morons (video)
Posted on | Saturday, February 6, 2010 | No Comments
There has been enormous interest in sponsors, newsletters and detailed explanations of market conditions. It seems as though there is still some intellect left as in others who also laugh at Zero hedge. Here is a preview of things to come.
A quick look at things regarding the following posts:
One
Two
Three
Four
Five
mkt analysis 2/7 from Walter Sobchak on Vimeo.
ZH comments
Posted on | Friday, January 29, 2010 | No Comments
The comments on their site are so stupid its unreal. No wonder 90% of these people are broke and lose all their money.