Tyler Durden @ ZeroHedge is a complete fucking dumbass... no seriously
Posted on | Sunday, March 28, 2010 | No Comments
Former Goldman Commodities Research Analyst Confirms LMBA OTC
Gold Market Is "Paper Gold" Ponzi
Tyler Durden's picture
Submitted by
Tyler Durden on 03/28/2010 12:47 -0500
When we put up a link to last week's CFTC hearing webcast little did we know that it would end up being the veritable (physical) gold mine (no pun intended) of information about what really transpires in the commodities market. First, we obtained direct evidence from Andrew Maguire (who may or may not have been the target of an attempt at "bodily harm" as reported yesterday) of extensive manipulation in the silver market. Today, Adrian Douglas, director of GATA, adds to the mountain of evidence that the commodities market, and the CFTC, stand behind what is potentially the biggest market manipulation scheme in the history of capital markets (we are assuming for the time being that all allegations of the Fed manipulating the broader equity and credit markets are completely baseless). Using the testimony of a clueless Jeffrey Christian, formerly a staffer at the Commodities Research Group in the Goldman Sachs Investment Research Department and now head and founder of the CPM Group, Douglas confirms that the "LBMA trades over 100 times the amount of gold it actually has to back the trades."
Christian, who describes himself as "one of the world’s foremost authorities on the markets for precious metals" yet, in the words of Gary Gensler, said "that the bullion banks had large shorts to hedge themselves selling elsewhere- how do you short something to cover a sale, I didn’t quite follow that?" and proves that current and former Goldman bankers are some of the most arrogant people alive, assuming that everyone else is an idiot and will buy whatever explanation is presented just because the CV says Goldman Sachs.
Children, when bullion banks are selling, its because someone(s) in physical is BUYING which drives the price up. Remember how when demand increases so does price from high school econ? Therefore banks (market makers) are inherently long which is why the sell short the futures. All the shit they have in inventory is APPRECIATING IN VALUE bc physical supply is dropping while they sell it to the buyers who are bid price up as supply drops. To cover the inevitable drop in price from the increase in physical inventory when retail sells ,(adds supply which results in lower prices, and banks HAVE to buy it back at lower prices), they short the futures!
The former GS guy is not arrogant, nor is he clueless as you claim, nor is he asuming everyone is an idiot as you also claim. You're just completely fucking retarded, Tyler. In fact, here's how clueless you are. You actually posted what I just said above in the video (for the illiterate) that you posted. Not only did this baffle your mind 1x while watching the video, you couldn't grasp the concept of supply and demand while seeing it in print for a second time.
J. CHRISTIAN: well, actually let’s go back to a concrete example of Mr. Organ when he was talking about August of 2008 when there was an explosion in the short positions in gold and silver held by the bullion banks on the futures market and he seemed to imply that that was somehow driving the price down. If you understand how those bullion banks run their books the reason they had an explosion in their short positions was because they were selling bullion hand over fist in the forward market, in the physical market, and in the OTC options market. Everyone was buying gold everywhere in the world so the bullion banks who stand as market makers were selling or making commitments to sell them material and so they had to hedge themselves and they were using the futures market to do that. So if you place position limits on the futures market they will have to find some other mechanism to hedge themselves …and they will. And someone else will provide that market…
Eco 101 strikes again.
Oh But wait he mispoke!???! OH SHIT!
CHAIRMAN GENSLER: I would like to follow up on Commissioner Dunn’s question for Mr. Christian, if I might, because I didn’t quite follow your answer on the bullion banks. You said that the bullion banks had large shorts to hedge themselves selling elsewhere, and I didn’t understand; I might just not have followed it and you’re closer to the metals markets than me on this, but how do you short something to cover a sale, I didn’t quite follow that?
J. CHRISTIAN: Well, actually I misspoke. Basically what you were seeing in August of 2008 was the liquidation of leveraged precious metals positions from a number of places and the bullion banks were coming back to buy it, and they were hedging those positions by going short on the COMEX and that is really what it was.
[Even on a second attempt Mr. Christian invents the most ridiculous poppycock to explain away the blatant manipulation of the precious metals in 2008. If, in his own words, investors were buying gold hand over fist everywhere in the world why would leveraged long holders dump all their long holdings? They would have ordinarily been making a fortune. The bank participation report of August 2008 shows that 2 or 3 bullion banks sold short the equivalent of 25% of world annual silver production in 4 weeks and the equivalent of 10% of world annual gold production. There was simultaneously a decrease in their long positions, which were almost non-existent anyway, which is incoherent with a notion the bullion banks were mopping up dumped leveraged investments. For an intelligent and coherent explanation of what happened in August 2008 read my CFTC written testimony here]
So now we have banks (any bank doesnt matter), going long physical and once again selling short futures to hedge in the face of a number of places selling? OH THE HORROR!!!
Here's the best part:
If, in his own words, investors were buying gold hand over fist everywhere in the world why would leveraged long holders dump all their long holdings?
Because you sell high and buy back low dumbass. Business 101.
We've Moved! go to the new site! here
BIDHITTER
Couple of vids to review
While building the latest systems I've had quite a bit of idle time and had a chance to review Free to Choose for the millionth time. Two episodes resonate well given our current times:
Important to note Fed policy has never followed statements by the Fed. Federal spending has always led to higher inflation,taxes and or both.
How people have grown dependent on government and the trap that entails.
We've Moved! go to the new site! here
BIDHITTER
Video recap week ending 3/26/2010
Posted on | Friday, March 26, 2010 | No Comments
This weeks topics:
S&P- bull, not enough info to get bear yet.
EURUSD- prob bull
Trade Tutorial!- You don't need any indicators besides price and volume
CL- bear
ZeroHedge- hypocrisy
three6Vid from Walter Sobchak on Vimeo.
Here's the clip from 25th hour I mentioned:
Related posts:
Zero Hedge tired of seeing computers trade like smart humans
Zero Hedge's new justification for spewing falsehoods
Interpreting volume and why Zero Hedge are morons
More nonsense from ZeroHedge
This subject is so important, I stole it
Posted on | Thursday, March 25, 2010 | 1 Comment
and
Many Traders Do Not Know About It.
"A trading system alone will not assure success without proper risk control, beginning with individual trades, extending to diversification of markets, and continuing until a portfolio of different trading strategies is created. Every trading style has losing streaks that will ruin an investor who begins trading at the wrong time without adequate capital; therefore the size of the position, the markets to trade, and when to increase or decrease leverage become important for financial survival." by Perry J. Kaufman
This image shows trading account drawdown percentages and what percentage gain is required to return your trading account back to the amount prior to the drawdown.
What percentage drawdown are you willing to have in your trading ?

Want smaller drawdowns ? - read on.
Learning risk control from a Coin Toss example
Simply because a coin only has two outcomes - heads or tails,
everybody knows the odds of a coin toss is 50 / 50.
With large numbers of Coin Tosses, results match the theoretical 50 / 50 outcome.
But most Traders commonly fall right into the Risk Trap of thinking each coin toss
will tend to alternate from heads to tails and then back to heads again.
Reality proves this only happens about 30% of the time.
So what happens the other 70% of the time ?
Exploring the Reality for an Actual 100 Coin Toss Exercise
Take out a coin,
On paper number from 1 -100
Make 100 actual coin tosses.
Recording each of the 100 coin tosses as Heads or Tails.
These next three images are a real recorded 100 coin toss event
Page1

Page 2

Page 3

The ACTUAL results showed a 14% spread instead of the expected 50 / 50 split.

This next image shows the long lossing streaks that occurred in this ACTUAL coin toss sample

The next image is critical to understand trading risk, it shows the trading account drawdown percentage that results from lossing streaks using different percentage of account equity at risk per trade and the single critical element you must control is what percentage of account equity you risk on each trade you take. That is a most important aspect to your trading success.

Traders the important part to understand from this posting is every strategy WILL have lossing streaks that most likely will be bigger than you might think. If you risk too big of a percent of equity on each trade you make your guaranteed given enough time trading to hit the Risk of Ruin event (in other words -> your account being busted).
I would not presume to suggest what another trader should risk. I do suggest to trade from an informed stand point of the relationships between position sizing, account equity at risk per trade and drawdowns. What I am saying it this posting is pick the maximum drawdown percentage your willing to suffer. Look at your strategies consecutive lossing steaks increase that by a safety margin and then use the chart to pick the percentage account equity at risk that will keep you under the drawdown level YOU have chosen.
Number One Worst Enemy Of Traders
Uncontrolled Risk from making large equity risking trades. Trading is not swinging for the fence home run while racking up a long string of strike outs. Controlling risk is the only way to stay in the trading game for the long haul.
Critical Key to Successful & Long Term Profitable Trading
Taking a profit from a very large number of extremely small percentage of equity risking trades. Keeping you account equity at risk per trade in the range from 1/2% to max of 3% . This equity at risk percentage per trade is not talking about the margin/buying power used to get in the trade it is the amount at equity at risk before your trade position hit your stoploss. If you do not have a very clearly defined stoploss on every trade, then look out your headed toward experience a Risk of Ruin experience.
Bottomline
1- Pick the maximum drawdown percentage your willing to suffer.
2- Look at your strategies consecutive loses then increase that number by a safety margin.
3- Next use the chart to pick the percentage account equity at risk that will keep you under the drawdown level YOU have chosen.
Low Risk Trading Strategy (from Van Tharp)
A Low Risk trading strategy is a strategy with a long-term positive expectancy that's traded at a equity percentage risk level to allow for the worst possible occurrence in the short term without the Risk of Ruin drawdown so that you are able to realize the long-term positive expectancy / profits from your strategy.
Video recap for week ending 3/19/2010
Posted on | Saturday, March 20, 2010 | No Comments
Sorry for the delay:
This weeks topics:
- Casino ads on the site to take your money
- Friday's sell off was healthy, paper bought small @ close
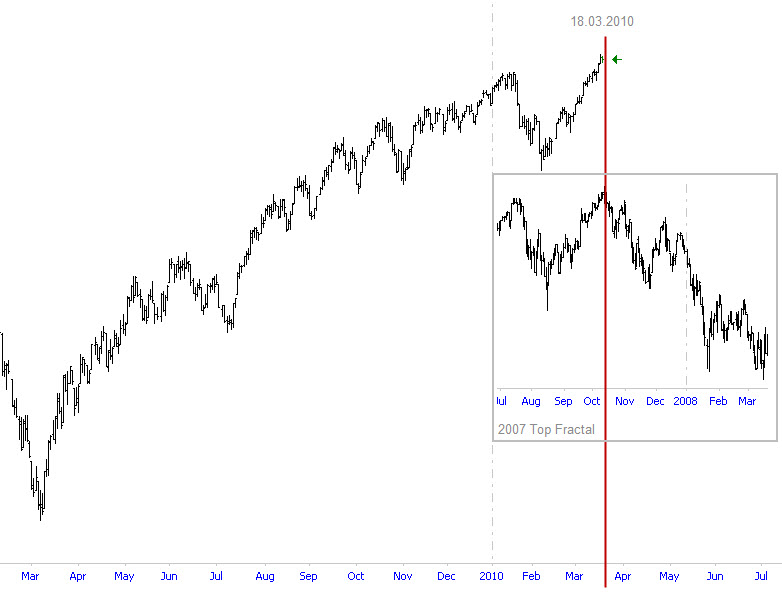
- S&P bias - down ****careful of Monday short squeeze****
- Euro Bias - flat, paper not in this last move down.
- Crude bias - down
- AUD bias - down
- 2007 vs 2010 market tops
- Slosh report
RecapWeek3/19 from Walter Sobchak on Vimeo.
The Slosh Report
Related posts:
Market recap vid for 3/12
Market sentiment ahead of the rally
A look at inflation vs deflation
A few observations
On the recap vid I said the near term direction of the S&P was a mixed bag of dicks. Now that my vol is showing up on the cash index, paper sold the cash 3/9, 3/10, 3/12 but not the futures. NYSE sentiment while negative today is really weak. Values of +/- 20K and greater indicates a healthy move up or down. We're currently at -2,600. There is still tons of time left today but this move down is not at all indicative of a giant trend reversal, just small time selling. Paper's still bullish.
Related posts:
Market recap vid for week 3/12/2010
Market sentiment before the rally
How to interpret volume
Signs of a market top
Posted on | Sunday, March 14, 2010 | No Comments
This is a just for fun post which probably has zero relevance. Feel free to add your ideas!
You know it's a market top when:
- FASB wants to reinstate M2M
- SEC bans short selling in dumb fk equity market
- Kudlow somehow turns even more bullish
- ZeroHedge gets unusually quiet on the "computers driving market higher" front
- Relative deflation ticks up yet equities rise
- The US actually starts recovering
- Some other CNBC anchor stats a hedge fund
- Dumb fk life insurance agents keeps referring to "when the market turns around" yet we're already up 70% from the lows
- Crammer tell yous to keeep you money in an insolvant bank again
- GOOG to 1000!
Words of wisdom from professor Friedman
"Politicians always try to avoid their last big mistake—which was clearly the 1930s. So every time there’s a contraction in the economy, they’ll overstimulate the economy, including printing too much money. The result will be a rising roller coaster of inflation, with each high and low being higher than the preceding one.”

Weekly recap vid for 3/12/2010
Posted on | Friday, March 12, 2010 | No Comments
Topics:
Volume: Don't be a dumbass look at the bigger picture
S&P: Mixed signals across cash and futures, bullish until demand drops off
Euro: Bullish, ZeroHedge finally agrees 3 weeks late.
Crude: Bearish, not time for 84 yet
Twitter: Gave you the jump on institutional buying this pm, while ZeroHedge blamed computers 20 min after we told you. Still no clue how they make money, they're as accurate as cnbc.
week 3/12 from Walter Sobchak on Vimeo.
Related posts:
Market Recap vid for week ending 3/5/2010
An adult look at volume
An adult look at volume
Posted on | Tuesday, March 9, 2010 | No Comments
I say adult because we'll use some logic and common fn sense vs little kiddies who are still afraid of the dark.
Below is a pic of the weekly S&P volume. The area between the magenta lines is roughly when greenspan cut interest rates and we had a credit bubble. When you have credit bubbles you also have asset bubbles, like the stock market. The horizontal is last weeks volume. Note that it is roughly the same as it was during the peak of the credit bubble.
For the sake of humanity, please hit those with bats who say we are running out of volume and no one is trading the markets anymore aside from robots and computers. They are clearly full of bs.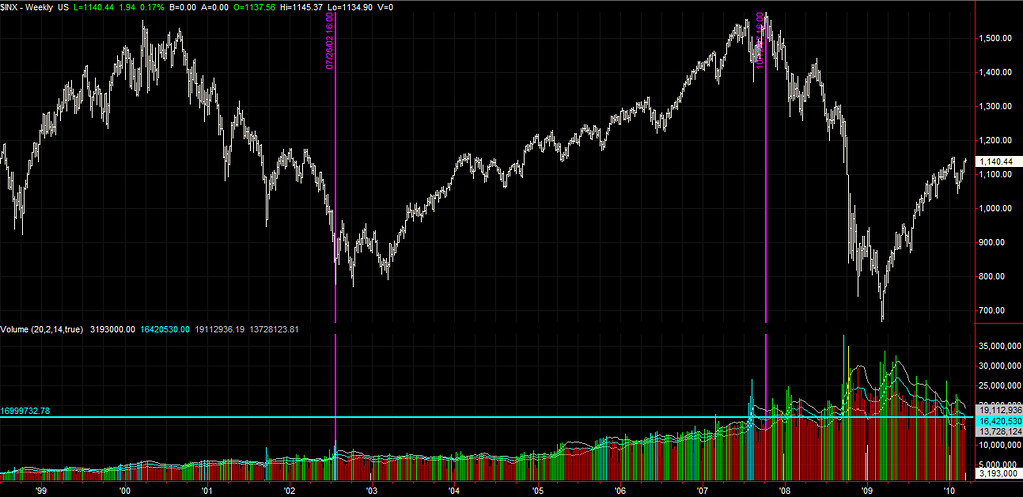
Market recap vid for week ending 3/5/2010
Posted on | Friday, March 5, 2010 | 2 Comments
week35 from Walter Sobchak on Vimeo.
Related posts:
Market recap for week ending 2/26/2010
Market sentiment the past 3 days
Posted on | Thursday, March 4, 2010 | No Comments
With ZH putting the lid on frivolous market manipulation posts, lets have a look at sentiment the past few days: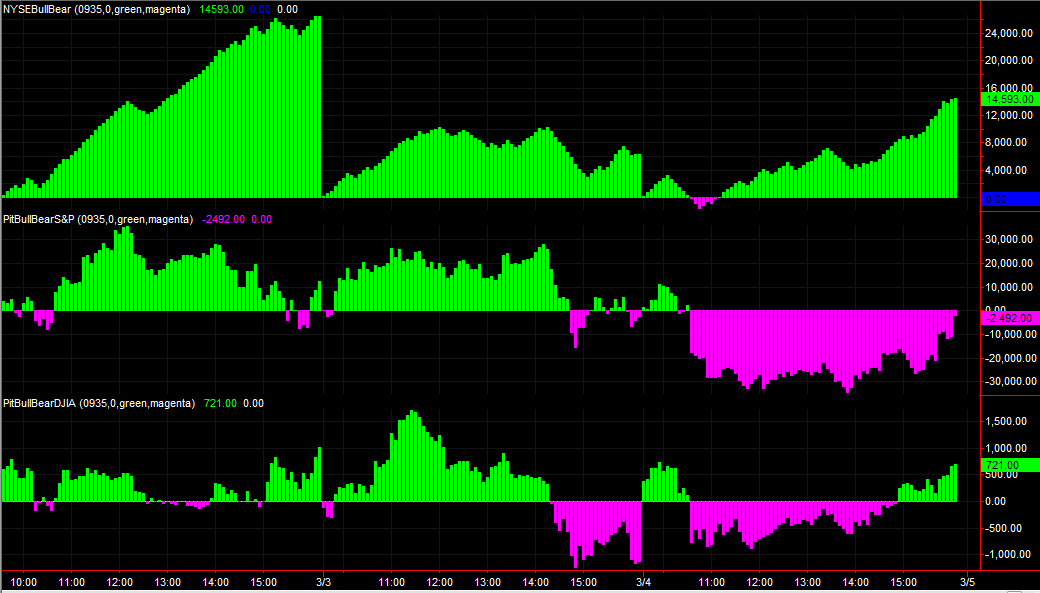
Green is bull, magenta bear. Greater than 20K in the cash market at the cash close is a healthy strong day. When the pit and djia futures conflict with the cash mkt, we get mixed range bound days. Cash market defines your bias, S&P pit and djia futures help you determine if everyone else is on board.
Related posts:
A look at market sentiment ahead of the rally
A look at conflict in the cash and futures pit