An adult look at volume
Posted on | Tuesday, March 9, 2010 | No Comments
I say adult because we'll use some logic and common fn sense vs little kiddies who are still afraid of the dark.
Below is a pic of the weekly S&P volume. The area between the magenta lines is roughly when greenspan cut interest rates and we had a credit bubble. When you have credit bubbles you also have asset bubbles, like the stock market. The horizontal is last weeks volume. Note that it is roughly the same as it was during the peak of the credit bubble.
For the sake of humanity, please hit those with bats who say we are running out of volume and no one is trading the markets anymore aside from robots and computers. They are clearly full of bs.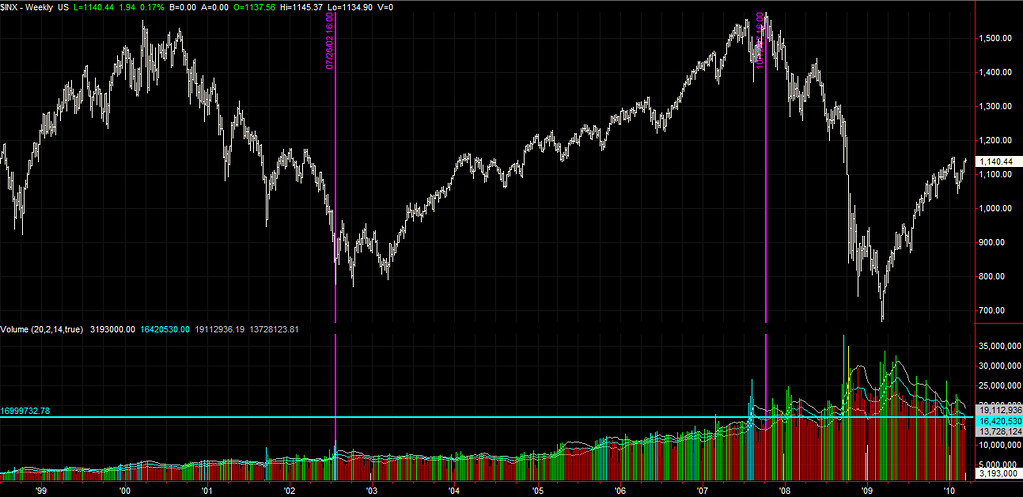
Leave a Reply
Note: Only a member of this blog may post a comment.